Health Promotion Perspectives, 10(3), 250-256; DOI:10.34172/hpp.2020.39
Original Article
Validity and reliability of the Arabic version of the "Personal Wellbeing Index-Adults" on adults with hearing impairment
Nesma Ahmed Lotfy1,*
1
Biostatistic Department, High Institute of Public Health, Alexandria University, Egypt
*Corresponding Author: Nesma Ahmed Lotfy, Email: califora9@gmail.com
© 2020 The Author(s). This is an open access article distributed under the terms of the Creative Commons Attribution License (http://creativecommons.org/licenses/by/4.0/), which permits unrestricted use, distribution, and reproduction in any medium, provided the original work is properly cited.
Abstract
Background: The Personal Wellbeing Index-Adults (PWI-A) is the most widely used instrument for measuring subjective-quality of life (QoL). The current study seeks to investigate the construct validity and reliability of the Arabic version of the PWI-A on adults with bilateral hearing impairment by comparing the single-factor solution with the two-factor solution.
Methods: A cross-sectional study was conducted at the Audio-Vestibular Medicine Unit of Alexandria University from July-2017 to January-2018. A total of 205 adults were interviewed to measure the subjective-QoL using the PWI-A instrument. Internal consistency was determined using both Cronbach’s alpha and composite reliability (CR). Validity was assessed by construct validity, including ordinal regression, ordinal exploratory factor analysis (OEFA), and ordinal confirmatory factor analysis (OCFA).
Results: The first four items of the PWI-A which are: satisfaction with living standard, health, achievements, and relationships were the most important indicators of subjective-wellbeing (Part r
2 0.0547, 0.0324, 0.0361, and 0.0225, respectively). OEFA suggested that the two-factor model contributes better than the single-factor model. OCFA validated this suggested solution; (two-factor: RMSEA=0.084 (90% CI=0.01-0.14); CFI=0.964; AIC=52.64; single-factor: RMSEA=0.119 (90% CI=0.07-0.17); CFI=0.922; AIC=62.77). Good internal consistency was also presented (two-factor: Cronbach’s alpha=0.719, 0.693; single-factor: Cronbach’s alpha = 0.750).
Conclusion: The Arabic version of the PWI-A is a multidimensional scale that consists of two dimensions: the first is related to subjective-QoL, and the second is related to satisfaction with the community. Thus, it is recommended to use the short version of the PWI-A with only four items to measure subjective-QoL, as it achieved sufficient reliability and construct validity.
Keywords: Validity, Reliability, Quality of life, PWI-A, Hearing loss
Introduction
Hearing impairment (HI) has been referred to as an unseen disability and a silent disorder.1 It is considered one of the most common types of sensory deficiency in humans which could be partial or total impairment in one or both ears.2,3 The World Health Organization (WHO) reported that HI is a worldwide health issue since more than 5% of the world’s population live with this disorder.3 It was estimated to be the third most common disability in 2008, and as such, it represents a substantial burden on society.4 In 2007, a national household survey was carried out in Egypt to estimate the prevalence of HI, which was reported as 16.0%.5
The WHO defined the quality of life (QoL) as “individuals’ perception of their position in life in the context of the culture and value systems in which they live, and in relation to their goals, expectations, standards, and concerns.”6 Some studies have demonstrated that HI reduces QoL and interferes with the people’s overall life, relationships, emotional well-being, and feeling of safety.7,8
Assessment of QoL among people with HI can be addressed through several instruments such as the Hearing Handicap Inventory for Adults, which is composed of emotional and socio-situational subscales.9 Satisfaction with life is considered a vital indicator of QoL. Therefore, the Personal Wellbeing Index–Adults (PWI-A) is the most used instrument worldwide in identifying how individuals feel regarding their lives.10 It includes seven satisfaction components, each related to a domain in QoL and was created from the worldwide question “How satisfied are you with your life as a whole?”11
Psychometric properties of the PWI-A instrument had been evaluated in different languages.11 A good psychometric property was shown in Brazil (reliability; Cronbach’s alpha = 0.796) and Chile (reliability; Cronbach’s alpha = 0.779).12 In addition, the PWI-A was found to have an adequate validity and reliability in previous studies of adults in both Australia11 and China.13,14
Many studies had measured the validity of the PWI-A using the criterion that each domain must contribute a unique variance when all domains are regressed against “Satisfaction with life as a whole.”11 It was noticed that the last three domains in some studies had the least contributions.11 Thus, we can hypothesis that the instrument consists of two dimensions rather than one dimension, which is subjective QoL. Therefore, the present study assessed the validity and reliability of the Arabic version of the PWI-A on adults with bilateral HI through the comparison of the single-factor solution with the two-factor solution.
Materials and Methods
Study design and sample characteristics
A cross-sectional study was carried out from July 2017 to January 2018 at the output patient clinic of Audio-Vestibular Medicine Unit in Alexandria University, Egypt. Individuals audiologically evaluated with bilateral HI and without complete deafness were invited to participate in the study. When the participants were already experience difficulty in hearing properly, talking close to such participant’s ears were sufficient to continue on with the interview.
Sample size
Based on the rule of thumb for exploratory factor analysis (EFA) and confirmatory factor analysis (CFA), Jöreskog and Sörbom15 suggested that, it is best to have a minimum of 10 participants per parameter estimated. However, guidelines as low as 5 to 10 observations per parameter have also been suggested by Floyd and Widaman.16 The minimum required sample size was 140 as the PWI-A consists of seven items and two different techniques (ordinal exploratory factor analysis [OEFA] and ordinal confirmatory factor analysis [OCFA]) will be used for validation. However, 205 individuals were enrolled.
Data collection methods and tools
A pre-designed structured questionnaire was created to include two parts:
-
Part I was designed to collect data about the socio-demographic characteristics of the study sample. This included: sex, age, marital status, educational level, and occupation.
-
Part II included the PWI-A instrument, which is comprised of seven satisfaction components, each one assessing a domain in QoL. The following components included are living standard, health, achievement, relationships, safety, community connectivity, and future security. Each domain is rated on a 3-point Likert scale (1= Not satisfied, 2 = Moderately satisfied, 3 = Satisfied). Overall satisfaction was also assessed by a global question, “How satisfied are you with your life as a whole?” which reflects the individual’s general life satisfaction (GLS)
11 (Supplementary file 1). Regarding the PWI-A scoring, each of the seven domains can be analyzed as a separate variable, or the seven domain scores can be summed up to get an average score, which reflects “Subjective Wellbeing”.
The PWI-A was translated into the Arabic language using a forward and backward method performed by three experts. First, one of the experts translated it into Arabic. Next, the Arabic version was translated back into the original language by another expert. Finally, the three experts compared the two versions and presented the final version of the Arabic PWI-A.
Face validity was assessed through a pilot study to check the applicability of the scale (grammar, organization, and appropriateness). Content validity was examined by three experts. These experts were requested to determine the essence of each item using a 3-point Likert scale (essential, not essential, and useful but not essential). All experts agreed that all items were essential. The panel of experts hailed from the High Institute of Public Health in Alexandria University. Discriminant validity was performed to examine the applicability of the PWI-A among literate and illiterate individuals. Such was done by discriminating between the scores of the first quartile (≤Q1) and the third quartile (≥Q3), using the Mann-Whitney test. For literate individuals (n = 100), the first quartile (Median (IQR) = 11(3)) and the third quartile (Median (IQR) = 19(2)) of the PWI-A scores were statistically significant (Z = -6.813, P = 0.000). Similarly, for the illiterate individuals (n = 95), the first quartile (Median (IQR) = 10(2)) and the third quartile (Median (IQR) = 18(2)) of the PWI-A scores were statistically significant (Z = -6.539, P = 0.000).
Statistical analysis
Data management
The data were collected over a period of six months. The collected data were checked for integrity and completeness. They were then, coded and fed to a computer software. The statistical package for the social sciences (IBM® SPSS® Statistics version 25.0) was used for data entry and descriptive analysis.
Data analysis
Descriptive statistics were calculated using a mean ± standard deviation (SD) or frequency and percent, where it is appropriate. The highest and lowest total scores were used to define the ceiling and floor effect, a percentage of more than 15% was considered for detecting the effect.17 In the current study, the floor effect was 1% while the ceiling effect was 4.4%. Correlations between the PWI-A items were calculated using Spearman’s rank correlation. Construct validity was assessed using three methods: (i) calculation of the unique and shared variance for the PWI-A items, (ii) OEFA, and (iii) OCFA.
Ordinal regression was performed to measure the adjusted R2 Nagelkerke, which describes the total explained variance of the PWI-A items on the GLS. The unique variance of each of the seven items as against the GLS was determined by squaring the semi-partial (part) correlation based on Spearman’s rank correlations. Statistical R programming was used for this purpose.18
OEFA was conducted using “the Proportional Odds Model Approach” (POM).19 Two separate exploratory factor analyses were conducted (single-factor, and two-factor models) to understand how the items are loaded on each respective factor. An oblique (promax) rotation was employed in the two-factor model. To check the assumptions for factor analysis; the Kaiser–Meyer–Olkin (KMO) test was used to evaluate the sampling adequacy, and Bartlett’s test of sphericity was performed to confirm the appropriateness of data.
OCFA was performed using weight least squares estimation and polychoric correlations with the asymptotic covariance matrix as a weight matrix in both models.20 To assess the model fit, various indices of fit were examined: chi-square, root mean square error of approximation (RMSEA), and its 90% confidence interval (value of 0.05 to 0.08 indicates a close fit) as an absolute fit index, adjusted goodness-of-fit index (AGFI), comparative fit index (CFI), and normed fit index (NFI) (with values close to 0.90 or 0.95 reflecting a good model fit) as incremental indices. The Akaike information criterion (AIC) was used to compare various factor structures. Lower AIC values would indicate a better fit.
The collected data were randomly split into two datasets, one for conducting OEFA (n = 100) and the second for validation using OCFA analysis (n = 105). The OEFA and OCFA were run using the LISREL version 8.8 software.21
Two different techniques were utilized to measure internal consistency. The first is Cronbach’s alpha, while the other is composite reliability (CR) which based on ordinal confirmatory factor loading (a value of CR > 0.6 indicated a good CR for a construct).
Results
Characteristics of the study population
In total, 60.5 % of the samples were females, the ages ranged from 18 to 65 years with a mean age of 42.33 ± 14.58 years. The majority of the enrolled adults were married (69.8%), unemployed (63.0%) and illiterate (46.3%) (Table 1). According to the PWI-A, 56.6% of the participants reported that they felt safe, 47.4% admitted satisfaction with their personal relationships, and 38% were satisfied with their achievements. Moreover, the mean average score was 2.08, SD = 0.52, skewness = -0.126, and kurtosis = -0.92 (Table 2).
| Table 1. The socio-demographic characteristics of enrolled adults with hearing impairment |
|
Socio-demographic characteristics
|
Total participants
(n = 205)
|
|
No.
|
%
|
| Sex |
|
|
| Male |
81 |
39.5 |
| Female |
124 |
60.5 |
| Age (y) |
|
|
| 18- |
46 |
22.4 |
| 30- |
84 |
41.0 |
| 50-65 |
75 |
36.6 |
| Min-Max |
18 – 65 |
| Mean ±SD |
42.33 ± 14.58 |
| Marital status |
|
|
| Single |
37 |
18.0 |
| Married |
143 |
69.8 |
| Divorce |
6 |
2.9 |
| Widow |
19 |
9.3 |
| Education |
|
|
| Illiterate |
95 |
46.3 |
| Low (primary and preparatory) |
49 |
23.9 |
| Middle (secondary, technical diploma) |
49 |
23.9 |
| High (university degree) |
12 |
5.9 |
| Occupation |
|
|
| Not working |
129 |
63.0 |
| Official work |
31 |
15.1 |
| Unofficial work |
29 |
14.1 |
| Pension |
16 |
7.8 |
|
Table 2. Personal Wellbeing Index - Adults (PWI-A) in the study sample
|
|
Items
|
Total participants (n = 205)
|
|
Not Satisfied
(%)
|
Moderately Satisfied (%)
|
Satisfied
(%)
|
| PWI1: living standard |
42.4 |
31.2 |
26.4 |
| PWI2: health |
16.1 |
51.2 |
32.7 |
| PWI3: achievement |
25.4 |
36.6 |
38.0 |
| PWI4: relationships |
30.2 |
22.4 |
47.4 |
| PWI5: safety |
30.7 |
12.7 |
56.6 |
| PWI6: community connectivity |
31.7 |
24.4 |
43.9 |
| PWI7: future security |
39.0 |
30.3 |
30.7 |
| Mean ± SD |
2.08 ± 0.52 |
| Kurtosis and skewness |
-0.92, -0.126 |
Construct validity
Spearman’s rank correlation among the seven items of the PWI-A and the GLS ranged from 0.131 to 0.61. The total explained variance on overall satisfaction was 60.9%. The unique contribution of standard of living to the total explained unique variance was 5.47%. The seven items contributed 15.1% in unique variance. This means that the shared variance between items was 45.8%. In addition, three items had a negligible contribution to the explained unique variance. These items included: safety, future security and community connectedness (Table 3).
|
Table 3. Spearman’s rank correlation between the seven items of the Personal Wellbeing Index – Adults (PWI-A)
|
|
PWI
|
PWI1
|
PWI2
|
PWI3
|
PWI4
|
PWI5
|
PWI6
|
PWI7
|
Part r
2
|
| PWI: GLS |
1 |
|
|
|
|
|
|
|
|
| PWI1: living standard |
0.610** |
1 |
|
|
|
|
|
|
0.0547 |
| PWI2: health |
0.581** |
0.555** |
1 |
|
|
|
|
|
0.0324 |
| PWI3: achievement |
0.536** |
0.475** |
0.427** |
1 |
|
|
|
|
0.0361 |
| PWI4: relationships |
0.455** |
0.315** |
0.397** |
0.283** |
1 |
|
|
|
0.0225 |
| PWI5: safety |
0.208** |
0.210** |
0.196** |
0.154* |
0.261** |
1 |
|
|
0.0005 |
| PWI6: community connectivity |
0.218** |
0.134 |
0.131 |
0.181** |
0.280** |
0.357** |
1 |
|
0.0009 |
| PWI7: future security |
0.347** |
0.292** |
0.250** |
0.285** |
0.363** |
0.485** |
0.466** |
1 |
0.0036 |
| Total explained unique variance |
0.151 |
| Adj R2 (Nagelkerke) |
0.609 |
| Total explained shared variance |
0.458 |
|
* Correlation is significant at the 0.01 level (2-tailed); ** Correlation is significant at the 0.05 level (2-tailed).
|
Exploratory factor analysis
Ordinal EFA was conducted (n = 100) on the seven items of the PWI-A. The KMO verified the sampling adequacy [KMO = 0.754 (fair)], while the Bartlett’s test of sphericity confirmed the factorability of the correlation matrix (χ² (21) = 183.236, P < 0.001).
The single-factor model revealed that all the items loaded well. However, items 2, 1, 4, and 3 had the smallest factor loadings, respectively. In the two-factor model, items 1,2,3, and 4 loaded better on the first factor while items 5, 6, and 7 loaded better on the second factor (Table 4). Items 2 and 7 had a standardized factor loading value greater than one, since the factor loading is a regression coefficient which can exceed one.22
|
Table 4. Ordinal Exploratory Factor Analysis (OEFA) for the Personal Wellbeing Index - Adults (PWI-A).
|
|
Items
|
Item-factor loadings
|
|
Single-factor
|
Two-factor
|
|
|
Factor one
|
Factor two
|
| PWI1: living standard |
0.706 |
0.838 |
0.096 |
| PWI2: health |
0.573 |
1.036 |
-0.272 |
| PWI3: achievement |
0.721 |
0.773 |
0.164 |
| PWI4: relationships |
0.718 |
0.589 |
0.326 |
| PWI5: safety |
0.92 |
-0.072 |
0.94 |
| PWI6: community connectivity |
0.849 |
0.008 |
0.846 |
| PWI7: future security |
0.965 |
-0.024 |
1.003 |
| Kaiser-Meyer-Olkin Measure |
0.754 |
| Bartlett's Test of Sphericity |
Approx. chi-square =183.236, df =21, P <0.001 |
Confirmatory factor analysis
An OCFA was performed after OFA to generalize the result on the validation sample. The results of single-factor model as against the two-factor model are displayed in Table 5. The single-factor model represents fitting with chi-square = 34.77, df =14, P = 0.001; RMSEA = 0.119 (90% CI = 0.07-0.17); AGFI = 0.932; CFI = 0.922; NFI = 0.879; AIC = 62.77. However, the two-factor model had a better fitting; chi-square = 22.64, df = 13, P = 0.046; RMSEA = 0.084 (90% CI = 0.01-0.14); AGFI = 0.952; CFI = 0.964; NFI = 0.92; AIC = 52.64.
|
Table 5. Ordinal Confirmatory Factor Analysis (OCFA) for the Personal Wellbeing Index – Adults (PWI-A)
|
|
Model
|
χ2 (
P
value)
|
RMSEA (90% CI)
|
(AGFI)
|
(CFI)
|
(NFI)
|
Model (AIC)
|
| Single – factor |
34.77 (0.001) |
0.119(0.07, 0.17) |
0.932 |
0.922 |
0.879 |
62.77 |
| Two – factor |
22.64 (0.046) |
0.084 (0.01, 0.14) |
0.952 |
0.964 |
0.92 |
52.64 |
Figures 1 and 2 show the entire standardized factor loading for the two models (single-factor model versus two-factor model). With regard to the second model, the loading of PWI5 and PWI6 items had slightly improved, while the last item (PWI7) had dramatically increased from 0.73 to 0.89. Moreover, the error term of PWI7 had dramatically decreased from 0.47 to 0.21. The highly correlated error in the two-factor model may be the result of similar expressions used in the instrument.
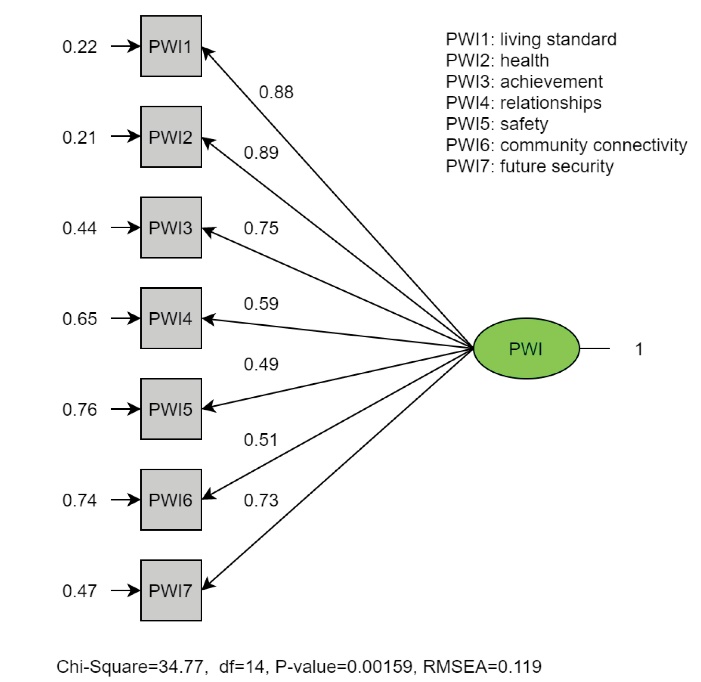
Figure1. The standardized parameter estimates of the ordinal confirmatory factor analysis of the Personal Wellbeing Index – Adults (PWI-A) for the single-factor model.
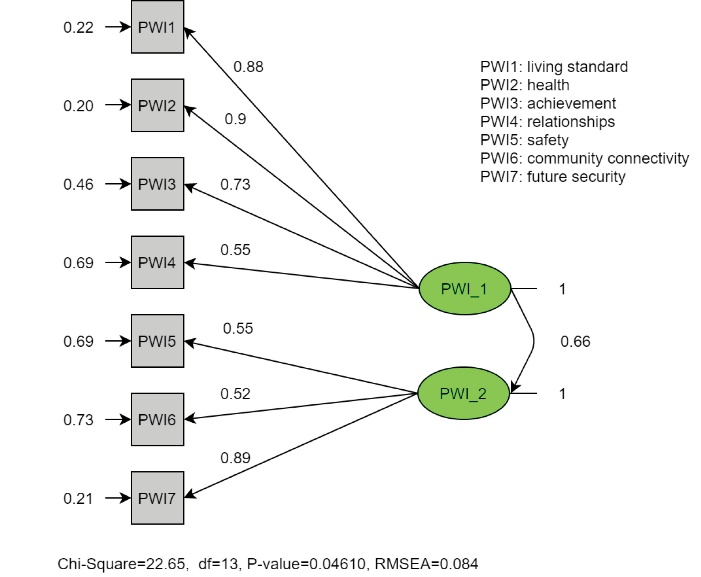
Figure2. The standardized parameter estimates of the ordinal confirmatory factor analysis of the Personal Wellbeing Index – Adults (PWI-A) for the two-factor model.
Reliability
The CR and Cronbach’s alpha values for the PWI-A were almost equal or greater than 0.7, indicating good reliability (Table 6).
|
Table 6. Reliability of the Personal Wellbeing Index - Adults (PWI–A)
|
|
Cronbach’s alpha if Item deleted
|
Single-factor
|
Two- factor
|
|
|
Factor one
|
Factor two
|
| PWI1: living standard |
0.717 |
0.622 |
- |
| PWI2: health |
0.718 |
0.615 |
- |
| PWI3: achievement |
0.722 |
0.664 |
- |
| PWI4: relationships |
0.718 |
0.728 |
- |
| PWI5: safety |
0.730 |
- |
0.627 |
| PWI6: community connectivity |
0.736 |
- |
0.641 |
| PWI7: future security |
0.697 |
- |
0.532 |
| Cronbach’s alpha |
0.750 |
0.719 |
0.693 |
| Composite reliability |
0.870 |
0.856 |
0.701 |
Discussion
HI can reduce the QoL because it influences one’s overall life, relationships with other people, and communication. Therefore, using an easy and short instrument for measuring QoL is necessary for considering their disability. Furthermore, the PWI-A is the easiest instrument that can measure subjective-QoL because it consists of only seven items. Several studies have tested the validity of the PWI-A in various countries, such as in Argentina, China, and others,but not in Egypt.11 Thus, this research will serve as a guideline for the PWI-A international well-being group.
Considering the contribution of each item on the GLS, the results were in line with van Beuningen and DeJonge’s who found that the first four items of the PWI-A (satisfaction with living standard, health, achievements, and relationships) had the highest unique variance contribution (0.15, 0.03, 0.04, and 0.07, respectively). However, the last three items had the lowest contributions (0.00, 0.00, and 0.00, respectively).23 A similar conclusion was drawn in several studies from different countries.11,24 Likewise, the total explained variance on overall QoL was 66% in the Netherlands,23 54% in the United States,24 and 60.9% in Egypt. Moreover, three studies assessed the validity in Argentina, with a total explained variance of 35%, 39%, and 57%, respectively.11
The major contributor item on overall satisfaction (GLS) varies between countries. Life achievement was the dominant item in the United States (unique variance = 11%),24 while the living standard was the dominant item in the Netherlands23 (unique variance = 15%) and Egypt (unique = 5.47%). We can conclude that every community has a different domain of satisfaction that may result from different characteristics of each country. These characteristics include: economic status, culture, and healthcare systems.
EFA was used to explore the PWI-A structure among gifted college students in the United States. A two-factor extraction that explaining approximately 60% of the variance was found. The first factor contained community connectedness, personal relationships, achievements in life, and future security. The other factor had personal safety, standard of living, and health.24 Another study had conducted factor analysis to examine the validity of the PWI-A among mothers of mentally retarded students in the North of Tehran, Iran. They reported that the PWI-A contributes to only one factor, which was subjective-QoL.10 The Netherlands had the same conclusion as Iran, with the factor loading of the factor analysis for the seven items as 0.81, 0.72, 0.81, 0.73, 0.65, 0.78, and 0.79, respectively.23 However, in this present study, the PWI-A contributed to the two-factor model better than the single-factor model (two-factor loading: factor-one: 0.838, 1.036, 0.773, 0.589, factor-two: 0.94, 0.846, 1.003). From this we can realize that the last three items, which are satisfaction with safety, community connectivity, and future security do not contribute to subjective-QoL since 56.6% of participants felt safe, 31.7% felt isolated from community, and 39.0% unsatisfied regarding future security.
A sample of 1965 participants forming Survey 22 of the Australian Unity Wellbeing Index25 were acquired to conduct CFA. CFA suggested that the PWI-A fit adequately in a uni-dimensional construct (chi-square = 139.43, P < 0.000, CFI = 0.96, RMSEA = 0.08) despite the difference between age, and gender across samples.26 In contrast, a single-factor model and two-factor model were performed using CFA in the USA,27 the single-model had an acceptable CFI (0.956), but a high RMSE (0.12, 95% CI = 0.1-0.14). On the other hand, the two-factor model (factor one: standard of living, health, achievement, and safety; factor two: relationships, community connectivity, future security) yield a poor model fit (RMSE > 0.08, CFI <0.95).27 In this study, the OCFA validated the results suggested by the OEFA. The two-factor model had a more adequate fit rather than the single-model (AIC = 52.64 and 62.77, respectively, RMSE = 0.084 (90% CI = 0.01-0.14), and 0.119 (90% CI = 0.07-0.17), respectively, and CFI = 0.964, and 0.922, respectively).
The PWI-A had good reliability in previous studies of adults in Australia and other countries, ranging from 0.7 to 0.85.11 In Egypt, the Cronbach’s alpha for the single-factor model was 0.75, while for two-factor model, it was 0.719 and 0.693. Since the two-factor model had a small number of items in each (factor one = four items, factor two= three items), the Cronbach’s alpha had slightly decreased compared to the single-factor model.28
The present study has some limitations. Most of the participants were women, illiterate, and unemployed. Moreover, the Likert scale used here was 3-point Likert-scale while the original version of the PWI-A utilized a 10-point Likert-scale. Because of this, abroad option for participants was not achieved. Consequently, further studies with the male population, and employed individuals using a 10-point Likert-scale is needed to generalize our findings.
Conclusion
The Arabic version of the PWI-A is a multidimensional scale that consists of two dimensions: the first one related to subjective-QoL and the second related to satisfaction with community. Thus, it is recommended to use the short version of PWI-A with only 4-items to measure the subjective-QoL among adults with HI, as it achieved sufficient reliability and construct validity.
Availability of data and materials section
All data are available from the corresponding author upon responsible request.
Ethical approval
The study was approved by the Institutional Review Board and the Ethical Committee of High Institute of Public Health in Egypt. Verbal consent was taken from the study participants after an explanation of the purpose and benefits of the research. Anonymity and confidentiality of the participants’ data was ensured and maintained.
Competing interests
The author declares that there are no competing interests.
Funding
There was no source of funding.
Acknowledgments
The author would like to thank Dr. Hesham Kozou, Professor of Otorhinolaryngology, Faculty of Medicine, Alexandria University (Egypt), for facilitating the recruitment of the study participants and data collection.
The author is grateful as well to Dr. Mona Hassan, Professor of Biostatistic, High Institute of Public Health, Alexandria University (Egypt), and Dr. Ekram Abd El-Wahab, Associate Professor of Tropical Health, High Institute of Public Health, Alexandria University (Egypt), for the critical appraisal of the manuscript. The participants of the study are also highly appreciated.
Supplementary Materials
Supplementary file 1 contains PWI-A instrument.
References
- Gates GA, Mills JH. Presbycusis. Lancet 2005;366(9491):1111-20. doi: 10.1016/s0140-6736(05)67423-5. [Crossref]
- Alshuaib WB, Al-Kandari JM, Hasan SM. Classification of hearing loss. In: Bahmad F Jr, ed. Update on Hearing Loss. Rijeka, Croatia: IntechOpen; 2015.
- World Health Organization (WHO). Deafness and Hearing Loss. Geneva: WHO; 2020. Available from: https://www.who.int/news-room/fact-sheets/detail/deafness-and-hearing-loss. Accessed June 2020.
- World Health Organization (WHO). The Global Burden of Disease: 2004 Update. Geneva: WHO; 2008.
- Abdel-Hamid O, Khatib OM, Aly A, Morad M, Kamel S. Prevalence and patterns of hearing impairment in Egypt: a national household survey. East Mediterr Health J 2007;13(5):1170-80. doi: 10.26719/2007.13.5.1170. [Crossref]
- World Health Organization (WHO). WHOQOL Measuring Quality of Life. Geneva: Division of Mental Health and Prevention of Substance Abuse, WHO; 1997.
- Kelly RJ, Atcherson SR. Quality of life for individuals with hearing impairment who have not consulted for services and their significant others: same- and different-sex couples. J Commun Disord 2011;44(3):336-44. doi: 10.1016/j.jcomdis.2011.01.004. [Crossref]
- Tsakiropoulou E, Konstantinidis I, Vital I, Konstantinidou S, Kotsani A. Hearing aids: quality of life and socio-economic aspects. Hippokratia 2007;11(4):183-6.
- Monzani D, Galeazzi GM, Genovese E, Marrara A, Martini A. Psychological profile and social behaviour of working adults with mild or moderate hearing loss. Acta Otorhinolaryngol Ital 2008;28(2):61-6.
- Agha Yousefi A, Alipour A, Sharif N. Reliability and validity of the “personal well-being index - adult” in mothers of mentally retarded students in north of tehran-iran. Iran J Psychiatry Behav Sci 2011;5(2):106-13.
- International Wellbeing Group. Personal Wellbeing Index. 5th ed. Melbourne: Australian Centre on Quality of Life, Deakin University; 2013.
- Sarriera JC, Casas F, Alfaro J, Bedin L, Strelhow MRW, Abs D, et al. Psychometric properties of the personal wellbeing index in Brazilian and Chilean adolescents including spirituality and religion. Psicol Reflex Crit 2014;27(4):710-9. doi: 10.1590/1678-7153.201427411. [Crossref]
- Smyth R, Nielsen I, Zhai Q. Personal well-being in urban China. Soc Indic Res 2009;95(2):231. doi: 10.1007/s11205-009-9457-2. [Crossref]
- Chen Z, Davey G. Happiness and subjective wellbeing in mainland China. J Happiness Stud 2008;9(4):589-600. doi: 10.1007/s10902-008-9092-7. [Crossref]
- Jöreskog KG, Sörbom D. LISREL 7: User’s Reference Guide. Mooresville, IN: Scientific Software; 1989.
- Floyd FJ, Widaman KF. Factor analysis in the development and refinement of clinical assessment instruments. Psychol Assess 1995;7(3):286-99. doi: 10.1037/1040-3590.7.3.286. [Crossref]
- Terwee CB, Bot SD, de Boer MR, van der Windt DA, Knol DL, Dekker J, et al. Quality criteria were proposed for measurement properties of health status questionnaires. J Clin Epidemiol 2007;60(1):34-42. doi: 10.1016/j.jclinepi.2006.03.012. [Crossref]
- Kim S. ppcor: an R package for a fast calculation to semi-partial correlation coefficients. Commun Stat Appl Methods 2015;22(6):665-74. doi: 10.5351/csam.2015.22.6.665. [Crossref]
- Jöreskog KG, Moustaki I. Factor analysis of ordinal variables: a comparison of three approaches. Multivariate Behav Res 2001;36(3):347-87. doi: 10.1207/s15327906347-387. [Crossref]
- Finney SJ, DiStefano C. Non-normal and categorical data in structural equation modeling. In: Hancock GR, Mueller RO, eds. Structural Equation Modeling: A Second Course. Greenwich, Connecticut: Information Age Publishing; 2006. p. 269-314.
- Jöreskog KG, Sörbom D. LISREL 8: User’s Reference Guide. Lincolnwood, IL: Scientific Software International; 2006.
- Deegan J. On the occurrence of standardized regression coefficients greater than one. Educ Psychol Meas 1978;38(4):873-88. doi: 10.1177/001316447803800404. [Crossref]
- van Beuningen J, DeJonge T. The Personal Wellbeing Index Construct Validity for the Netherlands. The Hague: Statistics Netherlands; 2011.
- Boazman J, Sayler M. Gifted American College Students, Application of the Personal Well-being Index (PWI) (Adult Version). In: Michalos AC, ed. Encyclopedia of Quality of Life and Well-Being Research. Dordrecht: Springer Netherlands; 2014. p. 2554-9. doi: 10.1007/978-94-007-0753-5.
- Cummins RA, Collard J, Woerner J, Weinberg M, Lorbergs M, Charini P. Australian Unity Wellbeing Index Survey 22: Report 22.0. The Wellbeing of Australians - Who Makes the Decisions, Health/Wealth Control, Financial Advice, and Handedness. Part A: The Report, Part B: Appended Tables. Melbourne: Australian Centre on Quality of Life, School of Psychology, Deakin University; 2009.
- Tomyn AJ, Fuller Tyszkiewicz MD, Cummins RA. The personal wellbeing index: psychometric equivalence for adults and school children. Soc Indic Res 2013;110(3):913-24. doi: 10.1007/s11205-011-9964-9. [Crossref]
- Sayler MF, Boazman J, Natesan P, Periathiruvadi S. Subjective well-being of gifted American college students: an examination of psychometric properties of the PWI-A. Gift Child Q 2015;59(4):236-48. doi: 10.1177/0016986215597748. [Crossref]
- Pallant FJ. SPSS Survival Manual: A Step by Step Guide to Data Analysis Using the SPSS Program. Crows Nest, NSW: Allen & Unwin; 2011.