Health Promotion Perspectives, 10(3), 238-243; DOI:10.34172/hpp.2020.37
Original Article
Mapping the relative risk of weight disorders in children and adolescents across provinces of Iran: the CASPIAN-V study
Marzieh Nasr1, Mohammadali Pourmirzaei2, Mohammad Esmaeil Motlagh3, Ramin Heshmat4, Mostafa Qorbani5, Roya Kelishadi2,*
1
Child Growth and Development Research Center, Research Institute for Primordial Prevention of Non-Communicable Disease, Isfahan University of Medical Sciences, Isfahan, Iran
2
Pediatrics Department, Child Growth and Development Research Center, Research Institute for Primordial Prevention of NonCommunicable Disease, Isfahan University of Medical Sciences, Isfahan, Iran
3
Pediatrics Department, Ahvaz Jundishapur University of Medical Sciences, Ahvaz, Iran
4
Chronic Diseases Research Center, Endocrinology and Metabolism Population Sciences Institute, Tehran University of Medical Sciences, Tehran, Iran
5
Non-communicable Diseases Research Center, Alborz University of Medical Sciences, Karaj, Iran
*Corresponding Author: Roya Kelishadi, Email: roya.kelishadi@gmail.com
© 2020 The Author(s). This is an open access article distributed under the terms of the Creative Commons Attribution License (http://creativecommons.org/licenses/by/4.0/), which permits unrestricted use, distribution, and reproduction in any medium, provided the original work is properly cited.
Abstract
Background: This study aimed to find possible spatial variation in children’s weight disorders and in predicting the spatial distribution.
Methods: The study population of this ecological study consisted of 7-18-year-old students living in 30 provinces of Iran. We used Besag, York and Mollie (BYM) model, a Bayesian model, to study the relative risk (RR) of underweight and excess weight (overweight and obese). The model was fitted to data using OpenBUGS (3.2.1) software.
Results: The highest RR of underweight was found in southeastern provinces. Whereas, the highest RR of excess weight was documented in northern, northwestern and capital provinces.Sistan-Balouchestan (RR=1.973; Bayesian confidence interval [BCI]: 1.682, 2.289), Hormozgan(RR=1.482; BCI: 1.239, 1.749), South Khorasan (RR=1.422; BCI: 1.18, 1.687) and Kerman(RR=1.413; BCI: 1.18, 1.669) had the highest RR of underweight. Mazandaran (RR=1.366; BCI:1.172,1.581), Gilan (RR=1.346; BCI: 1.15,1.562), Tehran (RR=1.271; BCI: 1.086,1.472) and Alborz (RR=1.268; BCI: 1.079,1.475) provinces are high risk regions for excess weight.
Conclusion: The significant variations in geographical distribution of weight disorders are because of various sociodemographic and ethnic differences. The current findings should be considered in health policy making in different regions of the country.
Keywords: Geographic mapping, Relative risk, Underweight, Overweight, Children
Introduction
The current status of children’s health in each nation displays the future of that nation. One of the most important health indicators is, in this regard, having appropriate weight in childhood and adolescence. Indeed, the consequences of either underweight or overweight can negatively affect the physical growth and psychological development of children.1 In addition, muscle weakness, delayed puberty, and low work productivity are negative outcomes of underweight.2 On the other hand, overweight children are more likely to become overweight adults, which indicates high risks for vascular disease, diabetes mellitus type 2, metabolic diseases, and mental disorders.3 Moreover, some studies link fatness to significantly lower quality of life.4,5 Morbidity and mortality in adulthood are possible consequence of pediatric obesity.6
Body mass index (BMI) is used to determine childhood overweight and obesity. Overweight is defined as a BMI at or above the 85th percentile and below the 95th percentile for children and teens of the same age and sex. Obesity is a BMI at or above the 95th percentile for children and teens of the same age and sex.7
Iran is the world’s 18th most populated country, whose population is estimated at 81.91 million in 2019. Its territory spans 1 648 195 km2 (636 372 m2), making it the 17th largest in the world.8
Childhood obesity is one of the serious problems in Iran with an increasing trend putting children and adolescents at risk for poor health. According to an Iranian national study, the prevalence of overweight and obesity was reported to be 9.7% and 11.9%, respectively.9 In a meta-analysis study in 2016, the prevalence of obesity in Iranian population below the age of 18 was estimated as 6.1%.10 In another meta-analysis study in 2014, the overall prevalence of obesity and overweight were estimated to be about 5.1% and 10.8%, respectively.11 However, these figures had great spatial variation over the 31 provinces of the country. In addition, different age and sex groups had large variations in the prevalence of obesity and overweight.12 This study is interested in finding possible spatial variation in children’s disorder weight and predicting its spatial distribution, considering the effect of age and sex. Although, many studies have been conducted on this subject in Iran, few of them have virtually focused on the spatial distribution.13-18
Disease mapping, the analysis of geographical variation in rates of disease, can identify areas of unusually high risk so that action may be taken. Nowadays, disease mapping methods are widely used in many countries to model the geographical distribution of common diseases such as cancer, premature mortality due to cardiovascular disease and obesity, malaria, health inequalities, public health improvements and mortality.19-23 In addition, these methods are used to formulate etiological hypotheses and finally provide a map of disease risk in a region to allow better resource allocation and risk assessment.24,25 In fact, one of the main needs of health specialists is the regulation of health promotion programs. In other words, the awareness of the geographical distribution of the relative risk (RR) of weight disorders in children and adolescents can help prepare programs to prevent many future health problems including adult obesity, type 2 diabetes and heart disease. Focusing on health promotion and disease prevention programs in the pediatric age group can provide effective strategies for reducing further population-level burden of disease.
Using traditional methods based on the raw or standardized data was been very common in the last decade. One of the most common methods used by many researchers to estimate the RR of disease is standardized mortality ratio (SMR) method. Although, it has several disadvantages. Firstly, the mean and variance of SMR are dependent upon expected numbers. And secondly, in regions where there are not any cases of disease, the SMR is zero. Today, the use of disease mapping methods has led to controlling the problem of SMR and creating the high-precision maps.26 On the other hand, previous studies in Iran only have focused on a small area. While awareness of disease trend can help to allocate the resources equitably.
The aim of the present study is mapping of RR of Iranian children and adolescent weight disorders in the provinces of Iran based on a national school-based program. Thus the Besag, York and Mollie (BYM) model has been used with the Bayesian approach.
Materials and Methods
Study design
This study is an ecological study at provinces of Iran level, based on the CASPIAN-V study, which was conducted in 30 provinces of Iran at both urban and rural levels in 2015.27
Participants
Students aged 7–18 years were the target population of the study. Students were selected using multistage, stratified cluster sampling method. The sample size was 14 400 students at the national level, i.e., 480 students in each province.27 Data of all these students were included in the current study without any restrictions.
Measurements
Weight and height were measured under standard protocols using calibrated instruments BMI was calculated by dividing weight (kg) by height squared (m2). In order to categorize BMI, the WHO growth curve was used in which BMI was classified into underweight (BMI <5th percentile), normal weight (BMI between 5th and 85th percentiles), overweight (BMI between 85th and 95th percentiles), and obese (BMI ≥85th–95th percentiles).7
Statistical analysis
BYM Model: BYM model was used to study the incidence of underweight and excess weight (overweight and obese) RR. In this model, {Yi,i = 1,...,I } and {Ei,i = 1,...,I } represent the number of observed and expected cases for province i , respectively, where Ei= ni(∑Yi)/( ∑ni) , i = 1, 2,…, I (n is the number of sample size of province).
It is assumed that Yi has Poisson distribution with the rate of μi= θiEi, where θi represents RR for province i . This model considers two sources of changes to justify the heterogeneity the rate of incidence in every region. Then, θi, the RR of diseases in i region, is modeled as:
logθ
i
=
α +
u
i
+ v
i
Where ui and vi represent non-structural and structural heterogeneity, respectively.24,28
This model was fitted using OpenBUGS 3.2.1 (rev 781).29 Convergence was checked by using Brooks-Gelman-Robin plots. Significance tests for parameters were done by the use of Bayesian confidence intervals (BCI) which are equivalent to P value. All the maps were provided using ArcGIS (10.4.1).30
Results
We intend to provide a map of children and adolescent weight disorders in Iran. We applied BYM model with Bayesian approach. Table 1 provides a descriptive statistic of data. Overall, 16.1% were underweight, and 20.8% had excess weight (overweight and obese).
|
Table 1. Frequency (n), BMI mean and Standard Deviation (SD) of underweight and excess weight cases according to sex and age (year)
|
|
Total
|
Sex
|
Age
|
|
|
Girl
|
Boy
|
≤10
|
11-14
|
≥15
|
|
n
|
Mean (SD)
|
n
|
Mean (SD)
|
n
|
Mean (SD)
|
n
|
Mean (SD)
|
n
|
Mean (SD)
|
n
|
Mean (SD)
|
| Underweight |
2279 |
13.97(1.54) |
1030 |
13.70(1.52) |
1249 |
14.19(1.51) |
841 |
12.82(0.94) |
915 |
14.07(1.13) |
523 |
15.64(1.30) |
| Excess weight |
2945 |
24.44(5.70) |
1428 |
24.43(4.36) |
1517 |
24.45(6.72) |
923 |
21.46(6.24) |
1242 |
24.52(5.02) |
780 |
27.85(3.79) |
Table 2 shows the RR, observed (Oi) and expected (Ei) numbers of underweight and excess weight cases in provinces of Iran, based on BYM model. Figures 1a and 1b show the map of RR of underweight and excess weight from BYM model, respectively. Sistan-Balouchestan (RR = 1.973), Hormozgan (RR = 1.482), South Khorasan (RR = 1.422) and Kerman (RR = 1.413) have the highest RR of Underweight as shown in Figure 1a. West-Azarbayejan, Mazandaran, Gilan, Tehran, Zanjan and Ardebil have the least RR of Underweight. West-Azarbayejan with RR = 0.499 has the least risk. According to Figure 1b, Mazandaran (RR = 1.366), Gilan (RR = 1.346), Tehran (RR = 1.271) and Alborz (RR = 1.268) provinces are high risk regions for excess weight.
|
Table 2. Relative risk (RR), 95% Bayesian confidence interval of RR (BCI), observed (Oi) and expected (Ei) number of Underweight and Excesss weight cases in provinces of Iran, based on Besag, York and Mollie (BYM) model
|
|
Provinces
|
Underweight
|
Excess weight
|
|
RR
i
|
BCI
|
O
i
|
E
i
|
RR
i
|
BCI
|
O
i
|
E
i
|
| Ardabil |
0.677 |
(0.51,0.86) |
112 |
96.764 |
1.161 |
(0.98,1.37) |
45 |
65.621 |
| West Azarbayjan |
1.066 |
(0.86,1.30) |
98 |
96.970 |
1.025 |
(0.86,1.22) |
85 |
75.041 |
| East Azarbayjan |
0.499 |
(0.36,0.65) |
104 |
84.797 |
1.193 |
(1.00,1.42) |
31 |
74.881 |
| Bushehr |
0.968 |
(0.77,1.18) |
124 |
99.033 |
1.170 |
(0.99,1.38) |
72 |
76.637 |
| Chaharmahal Bakhtiari |
1.056 |
(0.86,1.28) |
77 |
97.795 |
0.845 |
(0.70,1.01) |
82 |
76.637 |
| Isfahan |
1.070 |
(0.88,1.28) |
95 |
99.033 |
0.961 |
(0.82,1.13) |
84 |
76.637 |
| Fars |
1.015 |
(0.82,1.22) |
96 |
99.033 |
0.960 |
(0.81,1.13) |
75 |
76.637 |
| Qazvin |
0.953 |
(0.77,1.15) |
105 |
99.033 |
1.088 |
(0.93,1.27) |
78 |
76.637 |
| Gilan |
0.712 |
(0.55,0.89) |
139 |
99.033 |
1.346 |
(1.15,1.57) |
54 |
76.637 |
| Golestan |
0.948 |
(0.76,1.16) |
84 |
99.033 |
0.894 |
(0.74,1.07) |
73 |
75.52 |
| Hamedan |
0.994 |
(0.81,1.20) |
78 |
99.033 |
0.864 |
(0.72,1.02) |
79 |
76.637 |
| Hormozgan |
1.482 |
(1.24,1.75) |
67 |
99.033 |
0.736 |
(0.60,0.89) |
116 |
76.478 |
| Ilam |
0.857 |
(0.68,1.06) |
87 |
99.033 |
0.904 |
(0.75,1.08) |
64 |
76.637 |
| Kerman |
1.413 |
(1.18,1.67) |
90 |
99.033 |
0.869 |
(0.73,1.04) |
109 |
76.637 |
| Kermanshah |
0.782 |
(0.61,0.96) |
96 |
99.033 |
0.959 |
(0.81,1.14) |
56 |
76.637 |
| South Khorasan |
1.422 |
(1.18,1.68) |
62 |
99.033 |
0.694 |
(0.57,0.84) |
106 |
73.444 |
| Razavi Khorasan |
0.879 |
(0.70,1.08) |
93 |
99.033 |
0.926 |
(0.78,1.1) |
63 |
76.637 |
| North Khorasan |
0.920 |
(0.73,1.13) |
77 |
99.239 |
0.820 |
(0.67,0.99) |
70 |
76.637 |
| Khuzestan |
1.176 |
(0.97,1.41) |
120 |
99.033 |
1.135 |
(0.97,1.33) |
95 |
76.637 |
| Kohgiluyeh & Boyerahmad |
0.795 |
(0.63 , 0.98) |
94 |
99.033 |
0.965 |
(0.82,1.14) |
55 |
76.637 |
| Kurdestan |
1.135 |
(0.93,1.37) |
101 |
99.033 |
1.009 |
(0.85,1.19) |
92 |
76.797 |
| Lorestan |
0.988 |
(0.80,1.19) |
85 |
97.589 |
0.902 |
(0.76,1.06) |
76 |
76.158 |
| Markazi |
0.871 |
(0.70,1.06) |
94 |
99.033 |
0.983 |
(0.83,1.16) |
65 |
76.637 |
| Mazandaran |
0.612 |
(0.47,0.77) |
144 |
98.414 |
1.366 |
(1.18,1.59) |
38 |
76.637 |
| Alborz |
1.044 |
(0.84,1.27) |
129 |
99.033 |
1.268 |
(1.08,1.48) |
84 |
75.679 |
| Semnan |
1.051 |
(0.86,1.27) |
106 |
99.033 |
1.051 |
(0.90,1.23) |
85 |
76.637 |
| Sistan & Blouchestan |
1.973 |
(1.67,2.29) |
49 |
98.827 |
0.580 |
(0.46,0.72) |
156 |
76.637 |
| Tehran |
0.685 |
(0.53,0.85) |
131 |
99.033 |
1.271 |
(1.09,1.48) |
47 |
76.637 |
| Yazd |
1.245 |
(1.03,1.48) |
112 |
99.033 |
1.052 |
(0.90,1.24) |
98 |
76.637 |
| Zanjan |
0.674 |
(0.52,0.83) |
96 |
94.907 |
1.039 |
(0.87,1.22) |
46 |
76.637 |
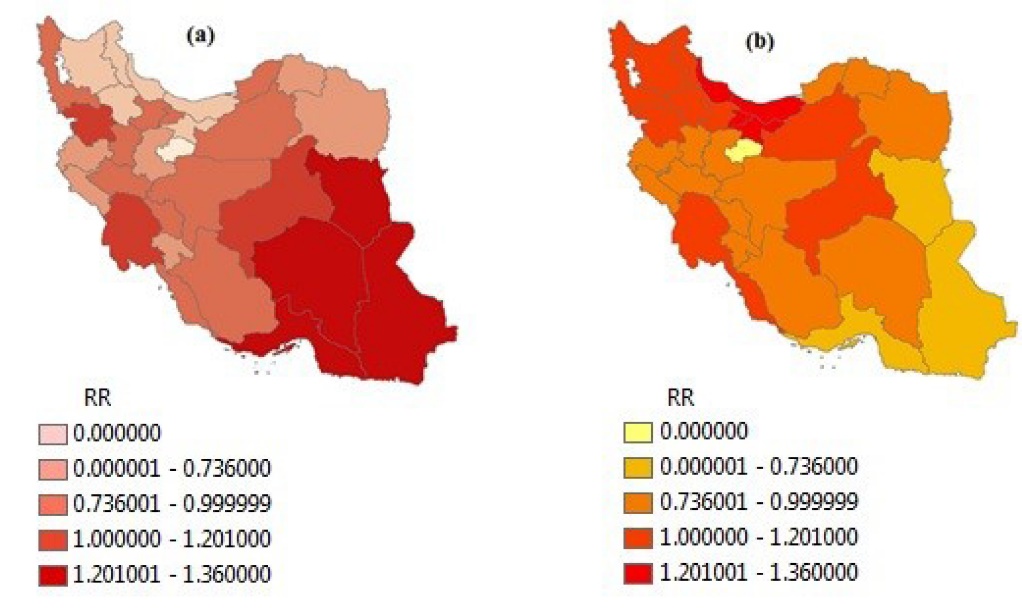
Figure 1. The map of relative risk of (a) underweight and (b) excess weight (overweight and obese) in Iranian children and adolescence by using BYM model; RR<0.7: low risk, 0.7≤RR<1: medium risk, 1≤RR<1.2: high risk, RR≥1.2: extremely high risk.
Figure 2 illustrates the findings of the study for girls and boys, separately. According to Figure 2a, Khuzestan (RR = 1.55), Hormozgan (RR = 1.425) and Sistan-Balouchestan (RR = 1.55) provinces have the highest RR of underweight for girls and South Khorasan (1.44), Kerman (RR = 1.40), Hormozgan (RR = 1.50) and Sistan-Balouchestan (RR = 2.19) provinces have the highest RR of underweight for boys. The most important finding observed is that girls of Khuzestan province are so affected by underweight.
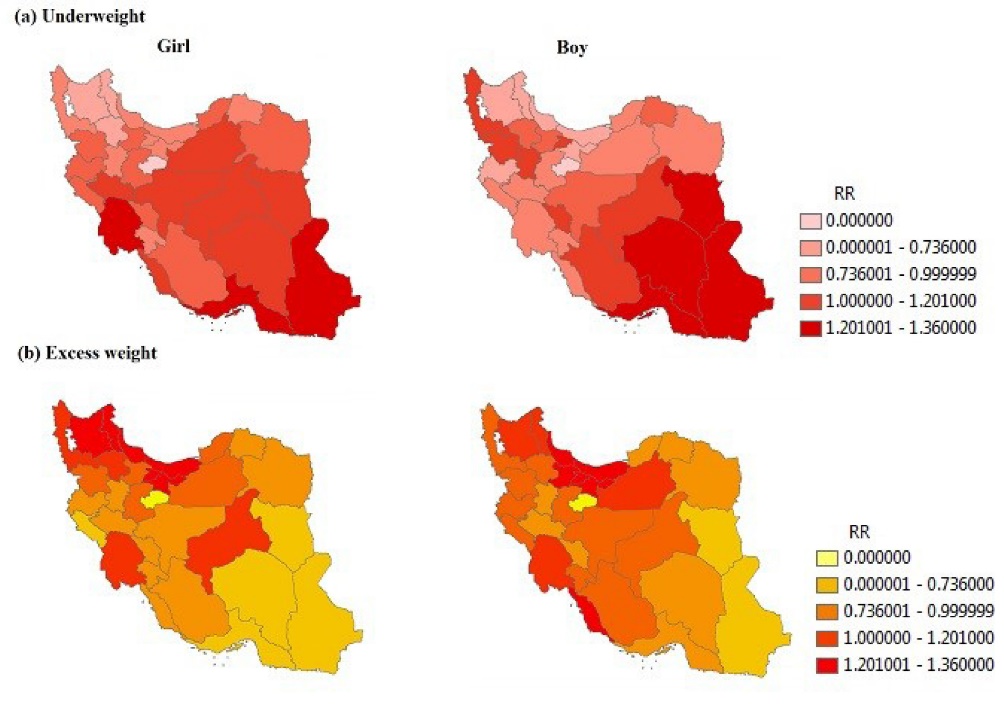
Figure 2. The maps of relative risk of (a) underweight and (b) excess weight, separated by sex in Iranian children and adolescence by using BYM model; RR<0.7: low risk, 0.7≤RR<1: medium risk, 1≤RR<1.2: high risk, RR≥1.2: extremely high risk.
According to Figure 2b, Mazandaran (RR = 1.28), Gilan (RR = 1.36), Ardebil (RR = 1.17), East-Azarbayjan (RR = 1.19), Tehran (RR = 1.19) and Alborz (RR = 1.17) provinces have the highest RR of excess weight for girls and Mazandaran (RR = 1.32), Gilan (RR = 1.20), Qazvin (RR = 1.23), Tehran (RR = 1.28), Alborz (RR = 1.24) and Bushehr (RR = 1.38) provinces have highest RR of excess weight for boys. The most important finding seen in these maps is that girls in Ardebil and East-Azarbayjan provinces and boys in Qazvin and Bushehr provinces are affected by excess weight. These findings have not been shown by maps of overall sex in Figure 1.
The results obtained from the separate age groups are shown in Figure 3. According to Figure 3a, Sistan-Balouchestan province has the highest RR of underweight in less than 10 years old (RR = 1.76) and 11-14 (RR = 2.04) age groups, respectively. West-Azarbayejan (RR = 2.43) and Khuzestan (RR = 2.17) provinces have the highest RR in the over 15-year-old age group.

Figure 3. The maps of relative risk of (a) underweight and (b) excess weight, separated by age groups in Iranian children and adolescence by using BYM model; RR<0.7: low risk, 0.7≤RR<1: medium risk, 1≤RR<1.2: high risk, RR≥1.2: extremely high risk.
According to Figure 3b, Alborz province (RR = 1.49) has the highest RR in the less than 10-year-old age group. Ardebil province (RR = 3.41) has the highest RR in the 11-14-year-old age group. However, no significant difference was seen among the provinces in the age group of those aged 15 or over.
Discussion
The current study presents the spatial pattern of RR of weight disorders by sex and different age groups in provinces of Iran by using Bayesian BYM model in a large representative sample of Iranian students. BYM model in comparison with traditional methods such as SMR, provides more reliable estimates and more precision maps by using the required information from spatial correlation among various areas. Bayesian approach to disease mapping includes prior knowledge about the variation in disease rates, as well observed cases in each region to provide a more precise spatial pattern of disease.24,25
It was revealed that the highest RR of excess weight (overweight and obesity) occurred in northern, northwestern and capital provinces including Gilan, Mazandaran, Alborz, and Tehran. This finding supports previous research in this field,13,14,18,31 whereas the highest RR of underweight occurred in southeastern provinces including Sistan-Balouchestan, Hormozgan, south Khorasan, and Kerman. These results seem to be consistent with the other research done in these areas.15-17
Although, according to a systematic review study, the prevalence of obesity in Iran was not very diverse,14 the finding is in agreement with some published studies which showed the prevalence of obesity among women and girls in northern and northwestern provinces.31-33
One unanticipated finding was related to mapping of underweight in the third age group (≥15). In contrast to previous finding that West Azarbayejan was one of the areas with high risk of excess weight, it is known as an area at risk of underweight in the present study. The reason for this is not clear but it may be a high tendency to consider thinness as the preferred body image style, especially in women.34
The existence of significant differences in geographical areas can be due to differences in lifestyle, food habits, health facilities, socio-economic status, and even genetics. In order to find out more precise information on risk factors in high-risk areas, studies should be conducted at an individual level.
In the present study, the target population was divided to two sex groups and three age groups, separately. Therefore, more accurate diagnosis of the at-risk population has been achieved.
However, our study had some limitations. Data was at provinces level and it would be better to study children’s disorder weight distribution on smaller regions such as counties.
Implications for practice and policy making
- Using the results of this study to recognize at-risk regions and population.
- Using the results of this study to implement health promotion and prevention program in at-risk regions.
Future direction
It is recommended to conduct a similar study for a longer period of time in more recent years. In addition, exploring the association between socio-environmental status and human developing index with disorder weight would be provide a new understanding of socioeconomic inequality.
Conclusion
Awareness of the geographical distribution of the RR of weight disorders in children and adolescents can contribute to the development of health promotion programs in the future. Taking childhood weight disorder, especially obesity, as one of the most serious problems of nations, establishing health promotion programs in schools including changing unhealthy eating habits and increasing physically activities can be effective. It is well documented that, training healthy behaviors to prevent chronic disease is easier during childhood and adolescence. Therefore, it is important to mention that performing these programs is only possible when parents would have close cooperation with school personnel.
Ethical approval
This study was performed using data of the CASPIAN-V study to assess the geographical distribution of collected data. Data management and analysis were performed without access to patients’ information. All personal information was kept confidential.
Competing interests
None to declare.
Funding
This study was conducted as part of a national surveillance program.
Authors’ contributions
RK, MP, MEM, RH and MO have made substantial contributions to conception, design and conducting. MN has been made contributions to dada analyses and drafting the study. RK has been made substantial contributions to critically review the manuscript for important intellectual content, and has given final approval of the version to be published.
Acknowledgments
Authors are thankful from the large team working on this large nationwide project.
References
- Best C, Neufingerl N, van Geel L, van den Briel T, Osendarp S. The nutritional status of school-aged children: why should we care? Food Nutr Bull 2010;31(3):400-17. doi: 10.1177/156482651003100303. [Crossref]
- Pasricha SR, Biggs BA. Undernutrition among children in south and south-east Asia. J Paediatr Child Health 2010;46(9):497-503. doi: 10.1111/j.1440-1754.2010.01839.x. [Crossref]
- Pulgarón ER. Childhood obesity: a review of increased risk for physical and psychological comorbidities. Clin Ther 2013;35(1):A18-32. doi: 10.1016/j.clinthera.2012.12.014. [Crossref]
- Çalışır H, Karaçam Z. The prevalence of overweight and obesity in primary schoolchildren and its correlation with sociodemographic factors in Aydin, Turkey. Int J Nurs Pract 2011;17(2):166-73. doi: 10.1111/j.1440-172X.2011.01922.x. [Crossref]
- Mistry SK, Puthussery S. Risk factors of overweight and obesity in childhood and adolescence in south Asian countries: a systematic review of the evidence. Public Health 2015;129(3):200-9. doi: 10.1016/j.puhe.2014.12.004. [Crossref]
- Curry SJ, Krist AH, Owens DK, Barry MJ, Caughey AB, Davidson KW, et al. Behavioral weight loss interventions to prevent obesity-related morbidity and mortality in adults: US preventive services task force recommendation statement. JAMA 2018;320(11):1163-71. doi: 10.1001/jama.2018.13022. [Crossref]
- Keith MH, Blomquist GE, Flinn MV. Anthropometric heritability and child growth in a Caribbean village: a quantitative genetic analysis of longitudinal height, weight, and body mass index in Bwa Mawego, Dominica. Am J Phys Anthropol 2019;170(3):393-403. doi: 10.1002/ajpa.23924. [Crossref]
- Lytra V. Language and ethnic identity. In: Preece S, ed. The Routledge Handbook of Language and Identity. New York: Routledge; 2016. p. 131-45.
- Bahreynian M, Kelishadi R, Qorbani M, Motlagh ME, Kasaeian A, Ardalan G, et al. Weight disorders and anthropometric indices according to socioeconomic status of living place in Iranian children and adolescents: the CASPIAN-IV study. J Res Med Sci 2015;20(5):440-53. doi: 10.4103/1735-1995.163960. [Crossref]
- Rahmani A, Sayehmiri K, Asadollahi K, Sarokhani D, Islami F, Sarokhani M. Investigation of the prevalence of obesity in Iran: a systematic review and meta-analysis study. Acta Med Iran 2015;53(10):596-607.
- Kelishadi R, Haghdoost AA, Sadeghirad B, Khajehkazemi R. Trend in the prevalence of obesity and overweight among Iranian children and adolescents: a systematic review and meta-analysis. Nutrition 2014;30(4):393-400. doi: 10.1016/j.nut.2013.08.011. [Crossref]
- Djalalinia S, Kelishadi R, Qorbani M, Peykari N, Kasaeian A, Nasli-Esfahani E, et al. A systematic review on the prevalence of overweight and obesity, in Iranian children and adolescents. Iran J Pediatr 2016;26(3):e2599. doi: 10.5812/ijp.2599. [Crossref]
- Gaeini A, Kashef M, Samadi A, Fallahi A. Prevalence of underweight, overweight and obesity in preschool children of Tehran, Iran. J Res Med Sci 2011;16(6):821-7.
- Jafari-Adli S, Jouyandeh Z, Qorbani M, Soroush A, Larijani B, Hasani-Ranjbar S. Prevalence of obesity and overweight in adults and children in Iran; a systematic review. J Diabetes Metab Disord 2014;13(1):121. doi: 10.1186/s40200-014-0121-2. [Crossref]
- Maddah M, Shahraki T, Shahraki M. Underweight and overweight among children in Zahedan, south-east Iran. Public Health Nutr 2010;13(10):1519-21. doi: 10.1017/s1368980010000388. [Crossref]
- Mohammadi M, Vaisi Raiegan AA, Mirzaei M, Zahednezhad H, Jalali R, Abbasi P. Prevalence of underweight in Iranian children: a systematic review and meta-analysis. Tehran University Medical Journal 2018;76(4):241-9. [Persian].
- Montazerifar F, Karajibani M, Rakhshani F, Hashemi M. Prevalence of underweight, overweight and obesity among high-school girls in Sistan va Baluchistan. East Mediterr Health J 2009;15(5):1293-300.
- Nouri Saeidlou S, Babaei F, Ayremlou P. Malnutrition, overweight, and obesity among urban and rural children in north of west Azerbijan, Iran. J Obes 2014;2014:541213. doi: 10.1155/2014/541213. [Crossref]
- Alramah MA, Samat NA, Mohamed Z. Mapping lung cancer disease in Libya using standardized morbidity ratio, BYM model and mixture model, 2006 to 2011: Bayesian epidemiological study. Sains Malays 2019;48(1):217-25. doi: 10.17576/jsm-2019-4801-25. [Crossref]
- Marmot M, Bell R. Social determinants and non-communicable diseases: time for integrated action. BMJ 2019;364:l251. doi: 10.1136/bmj.l251. [Crossref]
- Nyadanu SD, Pereira G, Nawumbeni DN, Adampah T. Geo-visual integration of health outcomes and risk factors using excess risk and conditioned choropleth maps: a case study of malaria incidence and sociodemographic determinants in Ghana. BMC Public Health 2019;19:514. doi: 10.1186/s12889-019-6816-z. [Crossref]
- Ogasawara K, Shirota S, Kobayashi G. Public health improvements and mortality in interwar Tokyo: a Bayesian disease mapping approach. Cliometrica 2018;12(1):1-31. doi: 10.1007/s11698-016-0148-3. [Crossref]
- Yasri S, Wiwanitkit V. Predicted prevalence of skin cancer with use of geographical informatics system mapping technique; report from tropical Indochina country, Thailand. J Inj Inflamm 2018;3(1):e01.
- Carlin BP, Louis TA. Bayes and Empirical Bayes Methods for Data Analysis. Boca Raton: Chapman and Hall/CRC; 2010.
- Banerjee S, Carlin BP, Gelfand AE. Hierarchical Modeling and Analysis for Spatial Data. Boca Raton, Florida: CRC Press/Chapman & Hall; 2014.
- Tango T, Takahashi K. A flexible spatial scan statistic with a restricted likelihood ratio for detecting disease clusters. Stat Med 2012;31(30):4207-18. doi: 10.1002/sim.5478. [Crossref]
- Motlagh ME, Ziaodini H, Qorbani M, Taheri M, Aminaei T, Goodarzi A, et al. Methodology and early findings of the fifth survey of childhood and adolescence surveillance and prevention of adult noncommunicable disease: the CASPIAN-V study. Int J Prev Med 2017;8:4. doi: 10.4103/2008-7802.198915. [Crossref]
- Lawson AB. Bayesian Disease Mapping: Hierarchical Modeling in Spatial Epidemiology. CRC press; 2013.
- Thomas A: OpenBUGS. Version 3.2.1 rev 781 [software]. Available from: https://www.mrc-bsu.cam.ac.uk/software/bugs/openbugs/. Accessed March 1, 2019.
- Environmental Systems Research Institute (ESRI): ArcGIS 10.4.1 for Desktop. Version 10.4.1.5686 [software]. Available from: http://www.esri.com/. Accessed March 4, 2019.
- Gargari BP, Behzad MH, Ghassabpour S, Ayat A. Prevalence of overweight and obesity among high-school girls in Tabriz, Iran, in 2001. Food Nutr Bull 2004;25(3):288-91. doi: 10.1177/156482650402500309. [Crossref]
- Seyedamini B, Malek A, Ebrahimi-Mameghani M, Tajik A. Correlation of obesity and overweight with emotional-behavioral problems in primary school age girls in Tabriz, Iran. Iran J Pediatr 2012;22(1):15-22.
- Rafraf M, Mohamadi E, Pourghassem Gargari B. Prevalence of overall and abdominal obesity among adolescent high school girls in Tabriz, Iran. Int Med J Malays 2013;12(1):27-32.
- Alipour B, Abbasalizad Farhangi M, Dehghan P, Alipour M. Body image perception and its association with body mass index and nutrient intakes among female college students aged 18-35 years from Tabriz, Iran. Eat Weight Disord 2015;20(4):465-71. doi: 10.1007/s40519-015-0184-1. [Crossref]