The relationship between family social capital, social media use and life satisfaction in adolescents
Health Promotion Perspectives, 9(4), 307-313; DOI:10.15171/hpp.2019.42
Original Article
The relationship between family social capital, social media use and life satisfaction in adolescents
Narjes Geraee1, Ahmad Ali Eslami2 ,*, Raheleh Soltani3
1
Student Research Committee, School of Health, Isfahan University of Medical Sciences, Isfahan, Iran
2
Department of Health Education and Promotion, Isfahan University of Medical Sciences, Isfahan, Iran
3
Department of Health Education and Promotion, Arak University of Medical Sciences, Arak, Iran
*Corresponding Author: Ahmad Ali Eslami,
Department of Health
Education and Promotion,
Isfahan University of Medical
Sciences, Isfahan, IR Iran.
Tel: +98-3137922652, Email: publichealth.dprt@yahoo.com
© 2019 The Author(s). This is an open access article distributed under the terms of the Creative Commons Attribution License (http://creativecommons.org/licenses/by/4.0/), which permits unrestricted use, distribution, and reproduction in any medium, provided the original work is properly cited.
Abstract
Background: Nowadays, two social phenomena are identified as factors that significantly influence life satisfaction among adolescents: family social capital and social media use. This study aimed to investigate the direct and indirect relationships between family social capital and life satisfaction, and the possible mediating role of social media use between the variables among Iranian adolescents.
Methods: In 2018, this cross-sectional study was carried out on 835 adolescents aged from 12to 19, in six high schools of Isfahan, Iran. Data were collected using a validated four-section questionnaire including demographic characteristics (3 items), life satisfaction (5 items), family social capital (31 items) and social media use (4 items) scales. IBM SPSS version 21 statistical software and AMOS version 24 were used to analyze the data. Structural equation modeling was used to assess the fit of model. The significance level of 0.05 was considered for all data analyses.
Results: The findings indicated that family social capital and social media use explained 50%of the variance in life satisfaction. Social media use was found with a partial mediating role in the association between family social capital and life satisfaction. Family social capital was the strongest predictor of life satisfaction (β =0.681, P<0.001). The relationship between social media use and life satisfaction was also statistically significant (β =- 0.12, P<0.001).
Conclusion: Social media use and family social capital should be considered while investigating the determinants of life satisfaction among adolescents.
Keywords: Adolescent, Satisfaction, Social capital, Social media, Structural equation modeling
Citation: Geraee N, Eslami AA, Soltani R. The relationship between family social capital, social media use and life satisfaction in adolescents.Health Promot Perspect. 2019;9(4):307-313. doi: 10.15171/hpp.2019.42.
Introduction
Life satisfaction is a cognitive component of subjective well-being,1 which reflects global and subjective assessments of an individual regarding his or her quality of life.2 Recently, life satisfaction has gained much attention as an indicator for optimal performance among adolescents.3-6 It may be considered as the psychological strength that helps adolescents to deal with different risks and challenges.7
Life satisfaction in adolescents is correlated with many family characteristics, such as family environment,8 family functioning,9 family composition,10 family cohesion,11 and family interactions.12 All of these characteristics may be encompassed as family social capital.13 On the other hand, social media have also gained increasing importance in the daily life of adolescents.14 It is, therefore, essential to study their possible effects on different aspects of well-being in adolescents.
Many studies have addressed the relationship between family social capital and life satisfaction.15-18 It is certain that family structure, functioning, and environment influence social media use among family members, especially adolescents.19-21 However, there is a scarcity in the studies that considered the mediating role of social media use while investigating the associations between family social capital and life satisfaction.
Previous studies have also investigated the effects of social media use on life satisfaction; however, their findings are inconsistent.22 Some studies have indicated a positive relationship between social media use and mental well-being, stating that using social media provides benefits for users with low self-esteem.23,24 In contrast, some studies have concluded that social media use has negative effects on life satisfaction in adolescents.25-27
Accordingly, the aim of this study was to investigate the relationships between family social capital, social media use and life satisfaction, and also to test the assumption that if the association between family social capital and life satisfaction may be mediated by social media use among adolescents (Figure 1).
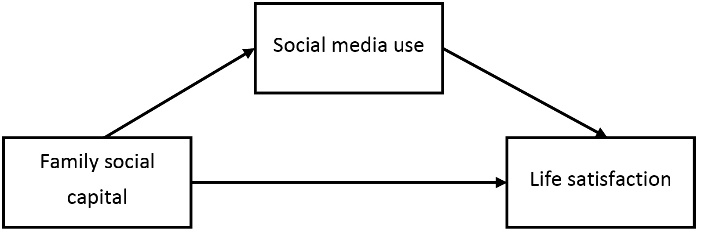
Figure 1. Hypothesized model of association between family social capital, social media use, and life satisfaction in adolescents.
Materials and Methods
Participants and procedure
In this cross-sectional study, data were collected from 835 adolescents. The mean age of participants was 15.15 (standard deviation = 1.73). Males constituted 51.3% of the participants. About one third of the participants belonged to under-supplied stratum (38.6%) (Table 1). Sample size was considered in accordance with the existing instructions regarding the sample size required for SEM studies.28 In order to have a representative sample of all socio-economic classes in Isfahan, stratified cluster sampling was used. Isfahan was divided into 3 strata based on a socioeconomic classification (well-supplied, moderately supplied, and under-supplied) conducted in a previous study in Isfahan.29 Expert opinions were also obtained to conduct the classification. Then, six high schools were randomly selected from each stratum (including both genders). Sample size was allocated to the selected school per the total number of students in each school. Finally, participants were selected via simple random sampling. Participants completed a pencil-and-paper questionnaire in schools and were informed about the voluntary nature of their participation.
| Table 1. Demographic attributes of the participants
|
|
Variables
|
Female
|
Male
|
Total
|
| Age, mean (SD) |
15.16 (1.74) |
15.14 (1.72) |
15.15 (1.73) |
| Socioeconomic status, No. (%) |
| Under-supplied |
145 (44.8) |
178 (55.1) |
323 (38.6) |
| Moderately supplied |
137 (50) |
137 (50) |
274 (32.8) |
| Well-supplied |
109 (45.7) |
129 (54.2) |
238 (28.5) |
Scales
Life satisfaction scale
Life satisfaction was assessed using the satisfaction with life scale. It includes 5 items such as, “In most ways my life is close to my ideal” and “The conditions of my life are excellent”, with a seven-point Likert scale ranging from 1 (strongly disagree) to 7 (strongly agree). The possible score ranged from 5–35 and the higher score indicated the higher life satisfaction.30 It is a standard scale with proven reliability and validity and has been used in assessing overall life satisfaction in many different studies.31-34 Internal consistency estimate for the scale was 0.87 in the present study.
Family social capital scale
Family social capital scale was developed and validated in the present study. First, extensive literature review and expert interviews were conducted to explore the concept and identify questionnaire items. At the next step, a panel of experts was established and their views were used for qualitative and quantitative evaluation of the items by the means of two separate report forms for content validity index (CVI) and content validity ratio (CVR). For CVI index, the value 0.79 was considered to be acceptable.35 For CVR index, the value 0.52 was determined to be acceptable.36 In order to determine face validity and understandability of the items, the scale was submitted to 30 members of the target group. They were asked to state their opinion about the understandability of each item using a Likert scale consisting of the “completely understandable”, “understandable”, “relatively understandable” and “non-understandable” options. In addition, they were also asked to state their general opinions regarding the questionnaire and each item. After collecting their views, the impact score or the understandability of each item was determined. At this stage, no item was eliminated, and only items with spelling mistakes were corrected.
The following subscales were obtained via exploratory factor analysis: family cohesion (16 items), family interactions (9 items), lack of family conflicts (3 items), and family control (3 items). Response format for all items was based on a 5-point Likert-type scale ranging from 1 (strongly disagree) to 5 (strongly agree). The possible score range was 31–155 and the higher score indicated the higher level of family social capital. Construct validity was measured via confirmatory factor analysis (CFA). The fit indices were satisfactory (chi-square mean/degree of freedom (CMIN/df) =3.414, root mean square error of approximation (RMSEA) = 0.042, goodness of fit index = 0.939, adjusted goodness of fit index = 0.924, and all comparative indicators were above 0.9). The results of intergroup analysis and correlation analysis supported the validity of the developed scale. The reliability of the scale was confirmed based on internal consistency (Cronbach’s alpha for all subscales = 0.69–0.94).
Social media use scale
In the literature, there are various scales for measuring social media use with a rising trend in the field; however, there are growing concerns about their validity.37 As the use of social media varies according to the cultural context of each society,38 it seems essential to develop a native scale. To do so, extensive literature review and interviews with experts and adolescents were performed. Seven items were identified showing the most routine activities of adolescents while using social media platforms. After assessing content validity of the items applying CVI and CVR forms, three items were removed. The final scale consisted of the following four items: sending or receiving images, texts, videos, or music; checking the profile pictures, pages, posts and stories of others; Sharing daily routines with others; reading, commenting and liking others’ posts. The participants were asked to score their involvement level in these activities using a five-point Likert scale ranging from 1 (very low) to 5 (very high). The possible score range was 4–20, within which the higher score indicated the higher level of social media use. Face validity of the scale was confirmed by 30 adolescents. Exploratory and confirmatory factor analyses indicated the factor structure of the scale as unidimensional. The reliability of scale was approved (Cronbach’s alpha = 0.83).
Statistics
The normality of data distribution was assessed by checking the skewness and kurtosis of the variables. All data analyses were performed in the IBM SPSS v.21 for Windows (IBM Corp., Armonk, NY, USA). Structural equation modeling (SEM) was used to analyze the relationships between life satisfaction, family social capital, and social media use. Data analysis was performed using IBM AMOS v.24 (IBM Corp., Chicago, IL, USA). In the SEM, the measurement model is used to identify the relationships between latent and manifest variables, and construct validity is examined by investigating four conditions: significance of factor loadings, factor loadings above 0.5, an average variance extracted (AVE) value above 0.5, a composite reliability (CR) value above AVE, and an AVE value above maximum shared variance (MSV) and average shared variance (ASV). Since the family social capital scale used in the study comprised four subscales, second-order CFA was utilized. According to Brown and Cudeck, the fit indices in this step were as follow: a RMSEA below 0.08, a parsimonious normed fit index above 0.5, Tucker-Lewis index (TLI), comparative fit index (CFI), and normed fit index above 0.9,39 a chi-square to degrees of freedom ratio (χ2/df) below 5.40 Considering the necessity to assess discriminant validity in the studies with latent variables,41 the Fornell and Larcker criterion was used to verify discriminant validity.42
In the next step, study hypotheses (latent variable relationships) were investigated using a structural model. The total R2 was checked to find out the extent to which family social capital and social media use collectively explained life satisfaction.
Finally, the bootstrapping method was utilized to determine the statistical significance of the indirect effects (i.e. mediated effects). This method is based on resampling and can result in 95% bias-corrected confidence intervals. If confidence intervals do not have a zero value (P< 0.05), then mediated effects are statistically significant.43
Results
Means and standard deviations and skewness for all variables as well as Pearson’s r correlations between the variables are presented in Table 2. There was a significant positive correlation between family social capital and life satisfaction (P< 0.001). Social media use was negatively correlated with life satisfaction and family social capital (P< 0.001).
| Table 2. Descriptive data and variable relationships
|
|
Variables |
LS
|
FSC
|
SMU
|
| LS |
1 |
|
|
| FSC |
0.615a |
1 |
|
| SMU |
-0.192a |
-0.153a |
1 |
| M (SD) |
24.51 (7.05) |
119.88 (21.10) |
12.88 (4.55) |
| Skewness |
-0.633 |
-0.954 |
-0.164 |
Abbreviations: LS= life satisfaction, FSC= family social capital, SMU= social media use.
a
P < 0.001.
|
In the first order measurement model, all factor loadings were statistically significant and above 0.5 and the fit indices were acceptable (CMIN/df = 3.386, RMSEA = 0.053, CFI = 0.903, TLI = 0.896). In the second order measurement model, almost all factor loadings were significant and above 0.5. Goodness of fit was also acceptable (CMIN/df = 3.428, RMSEA = 0.054, CFI = 0.865, TLI = 0.894).
In order to examine construct validity of the model, four conditions and the Fornell and Larcker criterion were investigated. As there is shown in Table 3, all factor loadings were significant and above 0.5; the AVE was above 0.5; the CR was above AVE; and the AVE was above MSV and ASV, which all indicated the model with proper construct validity. The Fornell and Larcker criterion also confirmed the construct validity of the scales (the second part of Table 3, from SMU to FSC).
| Table 3. Results of the construct validity examination
|
|
|
CR
|
AVE
|
MSV
|
ASV
|
SMU
|
LS
|
FSC
|
| SMU |
0.842 |
0.571 |
0.051 |
0.038 |
0.756 |
|
|
| LS |
0.880 |
0.598 |
0.489 |
0.270 |
-0.226 |
0.773 |
|
| FSC |
0.853 |
0.605 |
0.489 |
0.257 |
-0.160 |
0.699 |
0.778 |
Abbreviations: CR= composite reliability, AVE= average variance extracted, MSV= maximum shared variance, ASV= average shared variance.
|
According to Figure 2 and Table 4, family social capital and social media use explained 50% of the total variance in life satisfaction (R2). Compared to social media use, family social capital was the stronger predictor for life satisfaction (β = 0.681, P< 0.001). The relationship between social media use and life satisfaction was also statistically significant (P< 0.001). The relationship, however, was weak and inverse as compared to family social capital (β = -0.117, P< 0.001). The relationship between family social capital and social media use was also statistically significant and inverse (β = -0.160, P< 0.001).
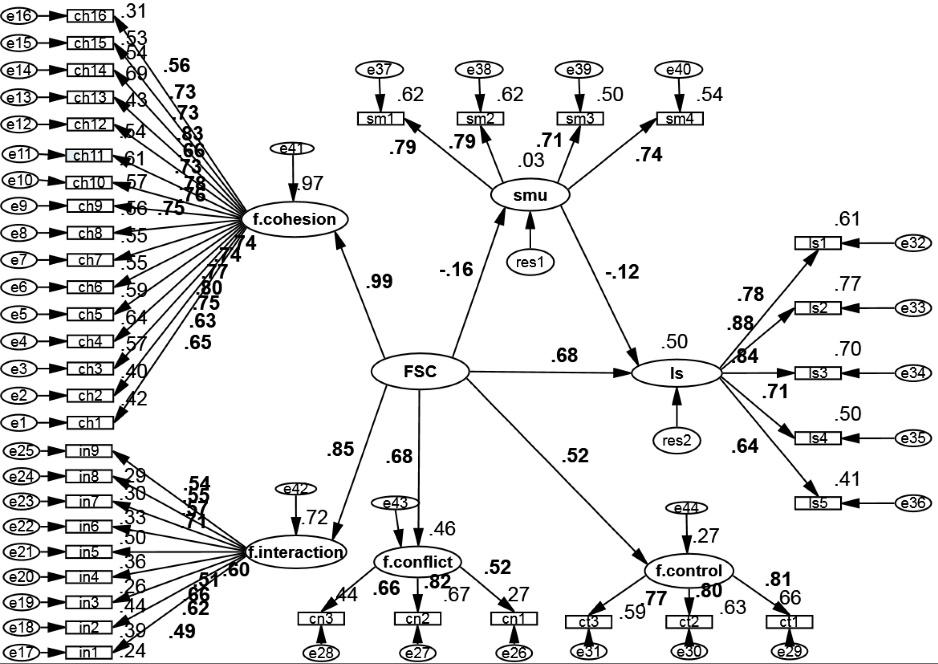
Figure 2. Direct and indirect path coefficients used for investigating the relationship between family social capital and life satisfaction, mediated by social media use. Note: f.cohesion= family cohesion, f.interaction= family interactions, f.conflict= lack of family conflict, f.control= family control, FSC= family social capital, SMU= social media use, LS= life satisfaction.
| Table 4. Structure model for predicting social media use and life satisfaction
|
|
Dependent
|
Predictor
|
B
|
SE
|
Beta
|
P
|
R
2
|
| SMU |
FSC |
-0.261 |
0.064 |
-0.160 |
<0.001 |
0.026 |
| LS |
SMU |
-0.121 |
0.032 |
-0.117 |
<0.001 |
|
| LS |
FSC |
1.148 |
0.078 |
0.681 |
<0.001 |
0.502 |
|
Abbreviations: LS= life satisfaction, FSC= family social capital, SMU= social media use.
|
Table 5 shows the bootstrapped direct, indirect, and total effectsof family social capital on life satisfaction. Life satisfaction was directly affected by family social capital. Both direct and indirect effects were statistically significant (partially mediated). In other words, with the inclusion of social media use as a mediator, the path coefficient from family social capital to life satisfaction was still significant (c’= 0.681, P< 0.0001).
| Table 5. Direct, indirect, and total effects of family social capital on life satisfaction with Bootstrapped confidence intervals
|
|
Effect of X on M (a)
|
Effect of M on Y (b)
|
Indirect effect (ab)
|
Direct effect (c')
|
Total effect (c)
|
CI
a
|
|
Lower
|
Upper
|
| 0.160b |
-0.117b |
0.019b |
0.681b |
0.699b |
0.01 |
0.05 |
|
Abbreviations:X=exogenous variable; M= mediator; Y= endogenous variable; CI = confidence Interval.
a Bias-corrected bootstrapping confidence intervals.
b
P < 0.0001.
|
Discussion
This study aimed to investigate the direct and indirect effect of family social capital on life satisfaction, and to assess the mediating role of social media use between the variables among adolescents in Isfahan, Iran. The results indicated social media use to be a statistically significant variable in the associations between family social capital and life satisfaction, that is, lower perceived family social capital was correlated with higher social media use, and higher social media use was in turn correlated with lower life satisfaction in adolescents. Family social capital and social media use explained 50% of the variance in life satisfaction in adolescents. Both family social capital and social media use were in statistically significant associations with life satisfaction among adolescents. However, the association of family social capital with life satisfaction was stronger than those between social media use and life satisfaction.
In line with previous studies, we also found that family social capital had a statistically significant positive association with life satisfaction in adolescents. Similar with our findings, Dubrov found that family social capital was a predictor of well-being among adolescents.17 Eriksson et al also reported that higher levels of family social capital were related to higher levels of well-being.18
Although adolescents spend a considerable amount of time with peers of the same age, family characteristics and attributes still have a stronger effect on their life satisfaction, which shows the necessity to determine the family characteristics that may be associated to their life satisfaction.7 The findings of this study indicated that family cohesion and family interactions had the strongest relationship with life satisfaction in adolescents. In line with our findings, previous studies also reported that life satisfaction and subjective well-being in adolescents are correlated with factors such as family cohesion,11 intra-family relationships,44,45 and parental support.8 Such studies clearly demonstrate that the quantity and quality of relationships within the family may have a detrimental role in satisfaction with family life among adolescents.
Contrary to some studies reporting the positive effects of social media use on life satisfaction and subjective well-being in adolescents,23,24,46 the findings of current study indicated a negative relationship between social media use and life satisfaction among adolescents. This finding, however, is in line with the findings of prior studies that indicated the negative effect of social media use on life satisfaction in adolescents.47-49 Some argue that such contradictions between the findings of different studies may be due to the ignorance of the usage type, stating that the users should be divided into two active and passive groups.50 While it is a noteworthy point, such conclusions are mostly related to adults who benefit from the ability of critical thinking,51 and may not be the case for adolescents who are mainly involved in emotional actions that are not fully based on thoughtful judgments.52
The results of our study also indicated a negative relationship between family social capital and social media use in adolescents (i.e. the lower the reported family social capital of adolescents, the higher the social media use). These results are in line with the findings of Mesch who reported that internet usage had a negative relationship with family closeness and a positive relationship with family conflicts.53 Lee also conducted a study on 1312 adolescents and found a negative correlation between the amount of adolescents’ online time and their interactions with their parents.54
Limitations
Development of a comprehensive model for life satisfaction determinants in different age groups is quite difficult. It is clear that in the presumed model we presented in this study, we have not investigated many possible variables, including gender, age, socioeconomic status, mental and physical health and etc. Such variables could play different roles in the model, including confounding, mediating, or moderating, which need further investigations in future studies.
Another limitation of this study was its cross-sectional design, which did not allow us to report the causal interpretations of the findings. There may be reverse causality between some of the variables. For example, social media use can be both the cause and the effect of life satisfaction. Longitudinal studies are recommended to provide more reliable causative interpretations.
Conclusion
In conclusion, social media use may have a partial mediator role in the association between family social capital and life satisfaction among Iranian adolescents. In future studies, social media use and family social capital should be considered while studying the determinants of life satisfaction among adolescents.
Ethical approval
The study was approved by the Ethics Committee and Research Deputy of Isfahan University of Medical Sciences [code of ethics No IR.MUI.REC.1395.3.668]. The purpose of this study was explained to the participants, and a written consent was also obtained from participating students volunteered to enter this study.
Competing interests
The authors declare that they have no competing interests.
Funding
This work was supported by vice-chancellery of Research and Technology at Isfahan University of Medical Sciences, Isfahan, Iran, [grant No. 395668].
Authors’ contributions
NG and AAE contributed to the design of the work, performed data collection and analysis, drafted the manuscript, performed significant revisions, and approved the final version of the manuscript. RS performed significant revisions, and approved the final version of the manuscript.
Acknowledgments
The authors appreciate the vice-chancellery of Research and Technology at Isfahan University of Medical Sciences, Isfahan, Iran for their financial support. Special thanks to sincere contribution of adolescents who participated in this study.
References
- Diener E, Heintzelman SJ, Kushlev K, Tay L, Wirtz D, Lutes LD, et al. Findings all psychologists should know from the new science on subjective well-being. Can Psychol 2017;58(2):87-104. doi: 10.1037/cap0000063. [Crossref]
- Diener E. Subjective well-being. The science of happiness and a proposal for a national index. Am Psychol 2000;55(1):34-43.
- Lyons MD, Huebner ES, Hills KJ, Van Horn ML. Mechanisms of change in adolescent life satisfaction: a longitudinal analysis. J Sch Psychol 2013;51(5):587-98. doi: 10.1016/j.jsp.2013.07.001. [Crossref]
- Jung S, Choi E. Life satisfaction and delinquent behaviors among Korean adolescents. Pers Individ Dif 2017;104:104-10. doi: 10.1016/j.paid.2016.07.039. [Crossref]
- Ginevra MC, Magnano P, Lodi E, Annovazzi C, Camussi E, Patrizi P, et al. The role of career adaptability and courage on life satisfaction in adolescence. J Adolesc 2018;62:1-8. doi: 10.1016/j.adolescence.2017.11.002. [Crossref]
- Jiang X, Lyons MD, Huebner ES. An examination of the reciprocal relations between life satisfaction and social problem solving in early adolescents. J Adolesc 2016;53:141-51. doi: 10.1016/j.adolescence.2016.09.004. [Crossref]
- Antaramian SP, Huebner ES, Valois RF. Adolescent life satisfaction. Appl Psychol 2008;57(s1):112-26. doi: 10.1111/j.1464-0597.2008.00357.x. [Crossref]
- Suldo SM, Huebner ES. Is extremely high life satisfaction during adolescence advantageous? Soc Indic Res 2006;78(2):179-203. doi: 10.1007/s11205-005-8208-2. [Crossref]
- Zhou J, Hu F, Wu J, Zou ZY, Wang YX, Peng HC, et al. Subjective Well-being and Family Functioning among Adolescents Left Behind by Migrating Parents in Jiangxi Province, China. Biomed Environ Sci 2018;31(5):382-8. doi: 10.3967/bes2018.049. [Crossref]
- Kwan YK. Life satisfaction and family structure among adolescents in Hong Kong. Soc Indic Res 2008;86(1):59-67. doi: 10.1007/s11205-007-9092-8. [Crossref]
- Raboteg-Šarić Z, Brajša-Žganec A, Šakić M. Life satisfaction in adolescents: The effects of perceived family economic status, self-esteem and quality of family and peer relationships. Drus Istraz 2009;18(3):547-64.
- Jiménez-Iglesias A, García-Moya I, Moreno C. Parent–child relationships and adolescents’ life satisfaction across the first decade of the new millennium. Fam Relat 2017;66(3):512-26. doi: 10.1111/fare.12249. [Crossref]
- Alvarez EC, Kawachi I, Romani JR. Family social capital and health - a systematic review and redirection. Sociol Health Illn 2017;39(1):5-29. doi: 10.1111/1467-9566.12506. [Crossref]
- Xie W. Social network site use, mobile personal talk and social capital among teenagers. Comput Human Behav 2014;41:228-35. doi: 10.1016/j.chb.2014.09.042. [Crossref]
- Litwin H, Stoeckel KJ. Confidant network types and well-being among older Europeans. Gerontologist 2014;54(5):762-72. doi: 10.1093/geront/gnt056. [Crossref]
- Widmer ED, Kempf N, Sapin M, Galli-Carminati G. Family beyond parents? An exploration of family configurations and psychological adjustment in young adults with intellectual disabilities. Res Dev Disabil 2013;34(1):207-17. doi: 10.1016/j.ridd.2012.07.006. [Crossref]
- Dubrov D. Family social capital as a predictor of parental and adolescent subjective well-being in Russia (Higher School of Economics Research Paper No. WP BRP 75/PSY/ 2017; 2017). Available from: https://papers.ssrn.com/sol3/papers.cfm?abstract_id=2973830. Accessed October 3, 2019.
- Eriksson U, Hochwalder J, Carlsund A, Sellstrom E. Health outcomes among Swedish children: the role of social capital in the family, school and neighbourhood. Acta Paediatr 2012;101(5):513-7. doi: 10.1111/j.1651-2227.2011.02579.x. [Crossref]
- Shi X, Wang J, Zou H. Family functioning and Internet addiction among Chinese adolescents: the mediating roles of self-esteem and loneliness. Comput Human Behav 2017;76:201-10. doi: 10.1016/j.chb.2017.07.028. [Crossref]
- Xin M, Xing J, Pengfei W, Houru L, Mengcheng W, Hong Z. Online activities, prevalence of Internet addiction and risk factors related to family and school among adolescents in China. Addict Behav Rep 2018;7:14-8. doi: 10.1016/j.abrep.2017.10.003. [Crossref]
- Bonnaire C, Phan O. Relationships between parental attitudes, family functioning and Internet gaming disorder in adolescents attending school. Psychiatry Res 2017;255:104-10. doi: 10.1016/j.psychres.2017.05.030. [Crossref]
- Goodman-Deane J, Mieczakowski A, Johnson D, Goldhaber T, Clarkson PJ. The impact of communication technologies on life and relationship satisfaction. Comput Human Behav 2016;57:219-29. doi: 10.1016/j.chb.2015.11.053. [Crossref]
- Ellison NB, Steinfield C, Lampe C. The benefits of Facebook “friends:” Social capital and college students’ use of online social network sites. J Comput Mediat Commun 2007;12(4):1143-68. doi: 10.1111/j.1083-6101.2007.00367.x. [Crossref]
- Best P, Manktelow R, Taylor B. Online communication, social media and adolescent wellbeing: a systematic narrative review. Child Youth Serv Rev 2014;41:27-36. doi: 10.1016/j.childyouth.2014.03.001. [Crossref]
- Kabasakal Z. Life satisfaction and family functions as-predictors of problematic Internet use in university students. Comput Human Behav 2015;53:294-304. doi: 10.1016/j.chb.2015.07.019. [Crossref]
- Błachnio A, Przepiorka A, Pantic I. Association between Facebook addiction, self-esteem and life satisfaction: a cross-sectional study. Comput Human Behav 2016;55:701-5. doi: 10.1016/j.chb.2015.10.026. [Crossref]
- Kraut R, Patterson M, Lundmark V, Kiesler S, Mukopadhyay T, Scherlis W. Internet paradox. A social technology that reduces social involvement and psychological well-being? Am Psychol 1998;53(9):1017-31. doi: 10.1037//0003-066x.53.9.1017. [Crossref]
- Wolf EJ, Harrington KM, Clark SL, Miller MW. Sample size requirements for structural equation models: an evaluation of power, bias, and solution propriety. Educ Psychol Meas 2013;76(6):913-34. doi: 10.1177/0013164413495237. [Crossref]
- Nastaran M, Abolhasani F, Izadi, M. Application of TOPSIS method in analysis and prioritizing sustainable development of urban zones (case study: urban zones of Isfahan). Geography and Environmental Planning 2010;21(2):83-100.
- Diener E, Emmons RA, Larsen RJ, Griffin S. The satisfaction with life scale. J Pers Assess 1985;49(1):71-5. doi: 10.1207/s15327752jpa4901_13. [Crossref]
- Kobau R, Sniezek J, Zack MM, Lucas RE, Burns A. Well‐being assessment: An evaluation of well‐being scales for public health and population estimates of well‐being among US adults. Appl Psychol Health Well Being 2010;2(3):272-97. doi: 10.1111/j.1758-0854.2010.01035.x. [Crossref]
- Sheikhi M, Houman HA, Ahadi H, Sepah Mansour M. Psychometric properties of satisfaction with life scale. J Clin Psychol 2011;5(19):15-26.
- Moghadam M, Salavati M, Sahaf R, Rassouli M, Moghadam M, Kamrani AAA. The Persian version of the “Life Satisfaction Scale”: construct validity and test-re-test reliability among Iranian older adults. J Cross Cult Gerontol 2018;33(1):121-34. doi: 10.1007/s10823-017-9340-6. [Crossref]
- Bayani AA, Mohammad Koocheky A, Goodarzi H. The reliability and validity of the satisfaction with life scale. Dev Psychol 2007;3(11):259-65.
- Polit DF, Beck CT. The content validity index: are you sure you know what’s being reported? Critique and recommendations. Res Nurs Health 2006;29(5):489-97. doi: 10.1002/nur.20147. [Crossref]
- Wilson FR, Pan W, Schumsky DA. Recalculation of the critical values for Lawshe’s content validity ratio. Meas Eval Couns Dev 2012;45(3):197-210. doi: 10.1177/0748175612440286. [Crossref]
- Sigerson L, Cheng C. Scales for measuring user engagement with social network sites: a systematic review of psychometric properties. Comput Human Behav 2018;83:87-105. doi: 10.1016/j.chb.2018.01.023. [Crossref]
- Pookulangara S, Koesler K. Cultural influence on consumers’ usage of social networks and its’ impact on online purchase intentions. Journal of Retailing and Consumer Services 2011;18(4):348-54. doi: 10.1016/j.jretconser.2011.03.003. [Crossref]
- Browne MW, Cudeck R. Alternative ways of assessing model fit. Sociol Methods Res 1992;21(2):230-58. doi: 10.1177/0049124192021002005. [Crossref]
- Bollen KA. Structural Equations with Latent Variables. New York: John Wiley & Sons; 1989.
- Hamid MRA, Sami W, Sidek MHM. Discriminant validity assessment: use of Fornell & Larcker criterion versus HTMT criterion. J Phys Conf Ser 2017;890(1):012163. doi: 10.1088/1742-6596/890/1/012163. [Crossref]
- Fornell C, Larcker DF. Evaluating structural equation models with unobservable variables and measurement error. J Mark Res 1981;18(1):39-50. doi: 10.2307/3151312. [Crossref]
- Preacher KJ, Hayes AF. Asymptotic and resampling strategies for assessing and comparing indirect effects in multiple mediator models. Behav Res Methods 2008;40(3):879-91.
- Prandini R. Family relations as social capital. J Comp Fam Stud 2014;45(2):221-34.
- Lau M, Li W. The extent of family and school social capital promoting positive subjective well-being among primary school children in Shenzhen, China. Child Youth Serv Rev 2011;33(9):1573-82. doi: 10.1016/j.childyouth.2011.03.024. [Crossref]
- Zhan L, Sun Y, Wang N, Zhang X. Understanding the influence of social media on people’s life satisfaction through two competing explanatory mechanisms. Aslib Journal of Information Management 2016;68(3):347-61. doi: 10.1108/AJIM-12-2015-0195. [Crossref]
- Kross E, Verduyn P, Demiralp E, Park J, Lee DS, Lin N, et al. Facebook use predicts declines in subjective well-being in young adults. PLoS One 2013;8(8):e69841. doi: 10.1371/journal.pone.0069841. [Crossref]
- Valkenburg PM, Peter J, Schouten AP. Friend networking sites and their relationship to adolescents’ well-being and social self-esteem. Cyberpsychol Behav 2006;9(5):584-90. doi: 10.1089/cpb.2006.9.584. [Crossref]
- Kim HH. The impact of online social networking on adolescent psychological well-being (WB): a population-level analysis of Korean school-aged children. Int J Adolesc Youth 2017;22(3):364-76. doi: 10.1080/02673843.2016.1197135. [Crossref]
- Chen W, Fan CY, Liu QX, Zhou ZK, Xie XC. Passive social network site use and subjective well-being: a moderated mediation model. Comput Human Behav 2016;64:507-14. doi: 10.1016/j.chb.2016.04.038. [Crossref]
- Potter WJ. Media Literacy. 4th ed. USA: Sage Publications; 2008.
- Bergsma L. Media literacy and health promotion for adolescents. J Media Lit Educ 2011;3(1):25-8.
- Mesch GS. Family relations and the Internet: Exploring a family boundaries approach. J Fam Commun 2006;6(2):119-38. doi: 10.1207/s15327698jfc0602_2. [Crossref]
- Lee SJ. Online communication and adolescent social ties: Who benefits more from Internet use? J Comput Mediat Commun 2009;14(3):509-31. doi: 10.1111/j.1083-6101.2009.01451.x. [Crossref]